These days, it’s not often I get asked for my GIS/mapping skills – maybe it’s just because “making maps” aren’t as interesting now that there are so many tools at our disposal. But sometimes, just sometimes, there are some questions that a simple map with dots can’t answer. So when a request came up to find out the percentage of people living in urban areas around the world, I thought “Challenge accepted.”

Basically the question to answer was “What is the urban population per country around the world?”. Data can normally be found on the population of towns, cities, and countries. However, to find the population of people living in urban centres is a more difficult question since we need to separate people in urban centres versus people living in rural or non-urban areas. While there are some sources that already provide this information, such as the World Bank or the UN World Population Prospect which uses recently available census or official population estimates, the following process is to document an attempt to estimate urban population using a mix of data, including satellite-derived ones from the Global Human Settlement framework. The main purpose for this request from the Internal Displacement Monitoring Centre was to improve their models on disaster and displacement risk.
I used three data sets for the analysis:
1.) Urban areas: The Global Human Settlement Layer (GHSL) provides a raster-based coverage of all urban centres around the world. The methodology of coming up with the coverage is extensively covered in the GHSL Data Package. Each pixel in the file is categorized by various levels of development which are summarized in the chart below. The 1km resolution and 2015 dataset was used.

2.) Population: The GHSL also has a spatial raster dataset that shows the distribution of population around the world, expressed as the number of people per cell. The 1km resolution and 2015 dataset was used to correspond to the urban area layer.
3.) Country borders: This was used to to distinguish the cells that fall within in a country’s borders as this details is not available in the above raster datasets. From the US Department of State, The Office of the Geographer’s Global Large Scale International Boundary (LSIB) Detailed Polygons file combines two datasets, the Office of the Geographer’s Large Scale International Boundary Lines and NGA shoreline data. The LSIB is believed to be the most accurate worldwide (non- W. Europe) international boundary vector line file available.
Because of the spatial dimension of the request… and because maps are cool… I used the Geographic Information Systems program QGIS (it’s available for free to download) to run the analysis.
- To show the urban areas from the GHSL, I started by running the Raster Calculator in QGIS. In the query, I selected all the pixels which had a Code > 20 (i.e. 21, 22, 23, 30) to only include suburbs, peri-urban, and urban centres. The image below shows all the “urban” areas in green.

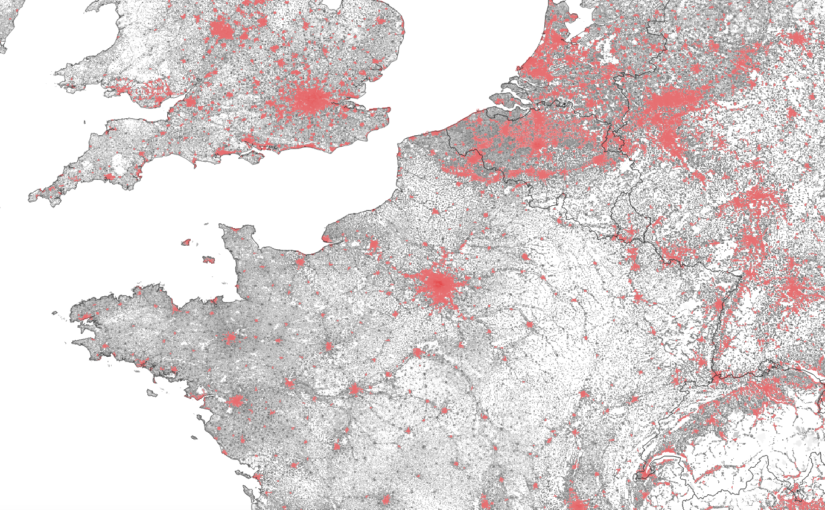
- Then I used this useful and simple tip for the Raster Calculator to extract all the cells in the Population layer (maskLayer) that overlapped with the “urban layer” (clipLayer) that I created in the previous step. This generated a new raster layer that shows only Population cells within urban areas. In the animated image below you can see the urban population centres in red and the rest of the population in black.
(maskLayer@1 >= 0) * clipLayer@1

- Finally, in order to associate the urban population cells to their respective countries, I ran the Zonal Statistics feature which calculates various statistics from the raster file, including the pixel count, sum, min, and max values, based on a vector layer. In this case, the urban population cells were aggregated to the country layer file. I then did the same process for the total population raster layer. This associated the urban population values and the total population values to the country boundary layer.

As you can see in the image below of France, the raster information that was processed in the previous steps were included in the country details.

After spending a weekend of figuring out the data, process and running the analysis (with a few computer crashes along the way because of all the data to process), see the result in the table below. There’s an additional column that calculates the percentage of the urban population areas compared to the total population in each country. Based on this analysis, there’s a huge extreme in terms of a country’s urban population: from Singapore, Monaco, and the Gaza Strip being the most urban at 100%, to island nations/territories being least urban, with, surprisingly, Laos PDR being the least urban landlocked country at 18%.
This is likely one of many methods to calculate urban population per country. If you have another method or data sources that you believe are more accurate, please make sure to leave a comment below!