
Corporate achievements are a necessary evil especially if you’re getting your funds and resources from donors, investors, etc. One of the ways to showcase this is usually through a glossy/sexy annual report. For 2010-2011, UNISDR, the UN’s office for disaster risk reduction, wanted to highlight it’s main accomplishments in a visual way. In addition to … Continue reading Corporate achievements for 2010-2011
Tag: infographic

Linking climate data with disaster symbols
With a bit of a short notice, I produced this infographic for a Swedish journalist who interviewed Margareta Wahlstrom, UNISDR’s ‘commander in chief’, on the impacts of disasters and climate change. It’s based on an MS Excel chart that was produced to highlight overall disasters in the Asia-Pacific region. The journalist wanted to reproduce the … Continue reading Linking climate data with disaster symbols

For Rio+20 with love…
One of the main features of the United Nations Conference on Sustainable Development (Rio+20) was to highlight seven key themes as a part of its “Future We Want” campaign. Since one of the themes was on Disaster Resilience, UNISDR wanted to highlight the 20-year impact of disasters since the original Rio Earth Summit back in … Continue reading For Rio+20 with love…

The Economic and Human Impact of Disasters in the last 12 years
Conceptualized and designed this infographic that shows the Economic and Human Impact of Disasters in the last 12 years. The data is sourced from the Brussels-based Centre for Research on the Epidemiology of Disasters (CRED) and their International Disasters Database (EM-DAT). The idea was to take global disaster statistics and visualize three key variables that … Continue reading The Economic and Human Impact of Disasters in the last 12 years

ECHO-funded UNISDR Media Trainings on Disaster Risk Reduction: 2010-2011
Conceptualized and designed this infographic to highlight one of UNISDR’s key activities with the media between 2010-2011. Given the global scope of the project, a map was chosen to best represent this scale and breadth of the trainings. A scale is used at the bottom of the graphic to provide more details to compare the … Continue reading ECHO-funded UNISDR Media Trainings on Disaster Risk Reduction: 2010-2011
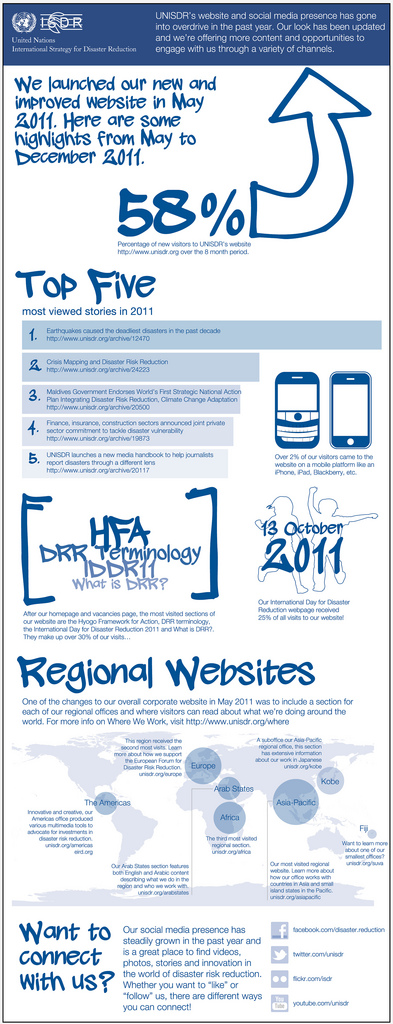
Graffiti and Website Stats
To highlight the impact of UNISDR’s website statistics for 2011, I provided the concept, typographic and visual design of this poster. It shows an overview of the rise in audience and visitors to the website in the year, the top five stories, the most search terms on the site, the most popular site visited in … Continue reading Graffiti and Website Stats

Life’s a whirlwind tour… time to make a change.
It’s been a while since I’ve written anything in this blog. I think it’s time for a change to coincide with the change in what my blog’s going to be about. If you look at the sidebar of my blog, I’ve been writing seriously in this blog since 2006. But most of it’s been about … Continue reading Life’s a whirlwind tour… time to make a change.

Resume/CV
In early 2010 I decided to redesign my resume or Curriculum Vitae in somewhat of less traditional way. The idea was to highlight my work around the world in a visual way and make the document standout more given that I was applying for highly competitive jobs in the United Nations and other international organizations. … Continue reading Resume/CV

The Humanitarian and Recovery Update
In addition to designing the HR Update logo, I also edited and designed the layout and publishing of the newsletter. The quarterly newsletter on humanitarian, disaster preparedness and recovery activities in Timor-Leste highlighted current and potential humanitarian conditions in the country, which include the issues of food security, internally displaced people’s resettlement, housing, flooding, and … Continue reading The Humanitarian and Recovery Update

Houses at Risk from Flooding
This map was created to provide an overall analysis of the flood vulnerability of areas in Timor-Leste, as part of an assessment prior to the rainy season in the country. The map was developed to support the humanitarian response as well as to help develop contingency plans by the United Nations and emergency preparedness measures … Continue reading Houses at Risk from Flooding